Processor_Tutorial
This
Tutorial will walk you through some of the experiments that can be done on an existing Processor demo model.
The following screenshot shows the layout of the demo model (ARM Cortex A77):
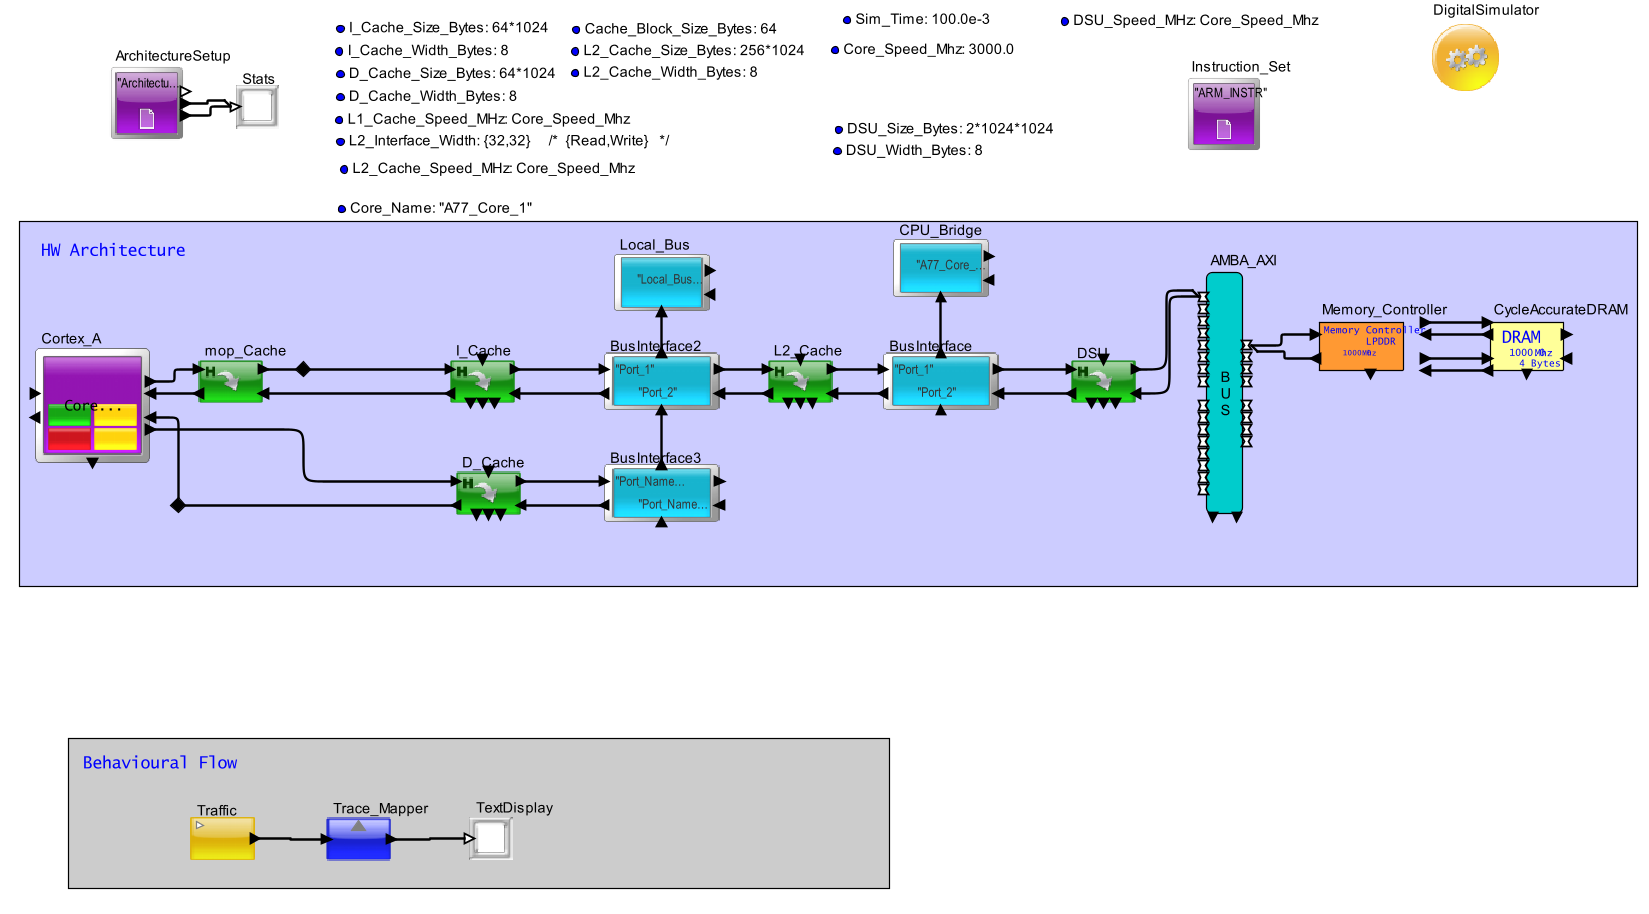
What does Behaviour Flow and Hardware Architecture mean?
Behavioral flow -> sequence flow representation of how tasks will be executed
HW architecture -> Representation of how the HW architecture of a device is implemented
Example:
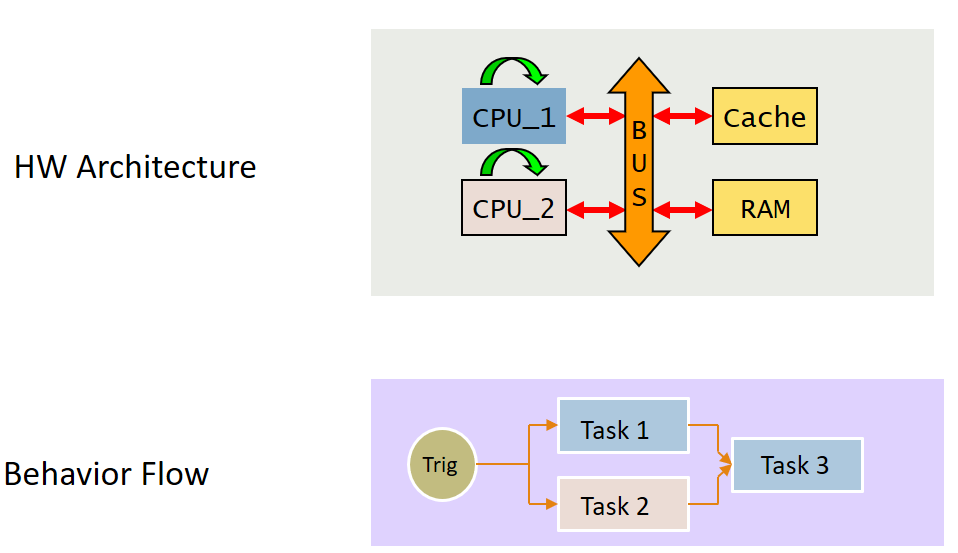
Task sequence defined from behavior flow
Task 3 dependent on the output of Task 1 and Task 2
Task mapping to CPU cores done from behavior flow
Task 1, 3 -> CPU_1
Task 2 -> CPU_2
By this approach, changes in behaviour flow doesnt affect the hardware architecture and vice versa.
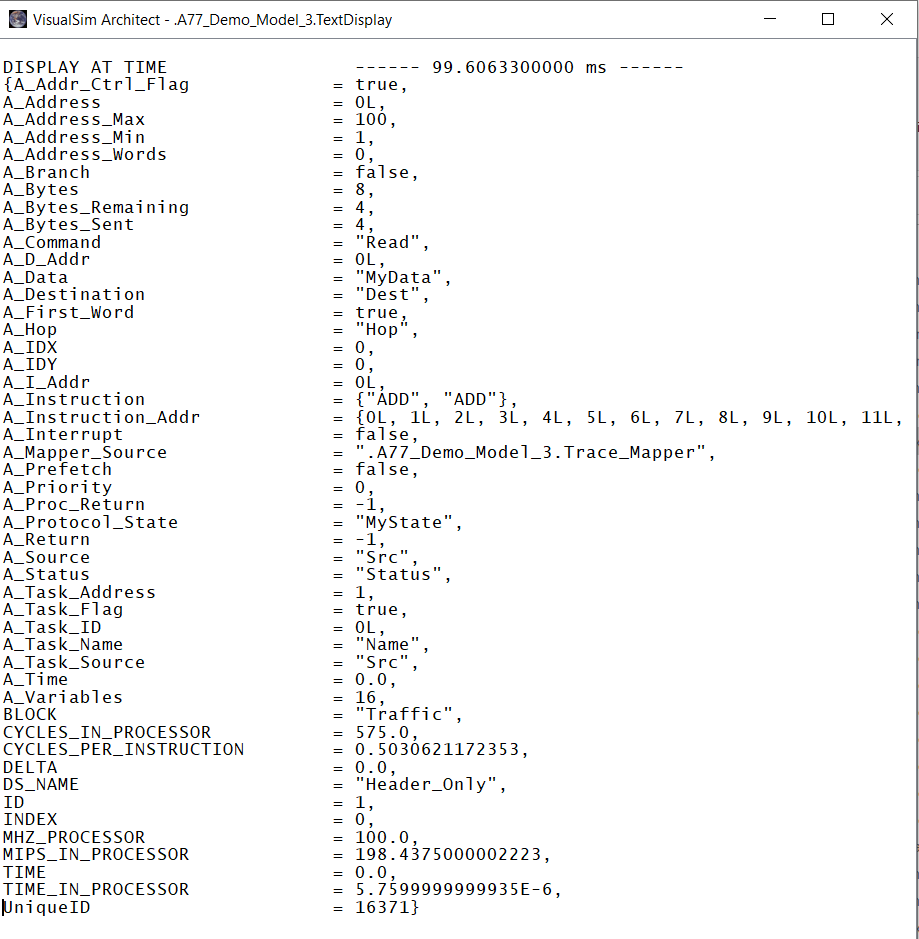
Statistics and Reports generated from the above demo model <Default Settings> :
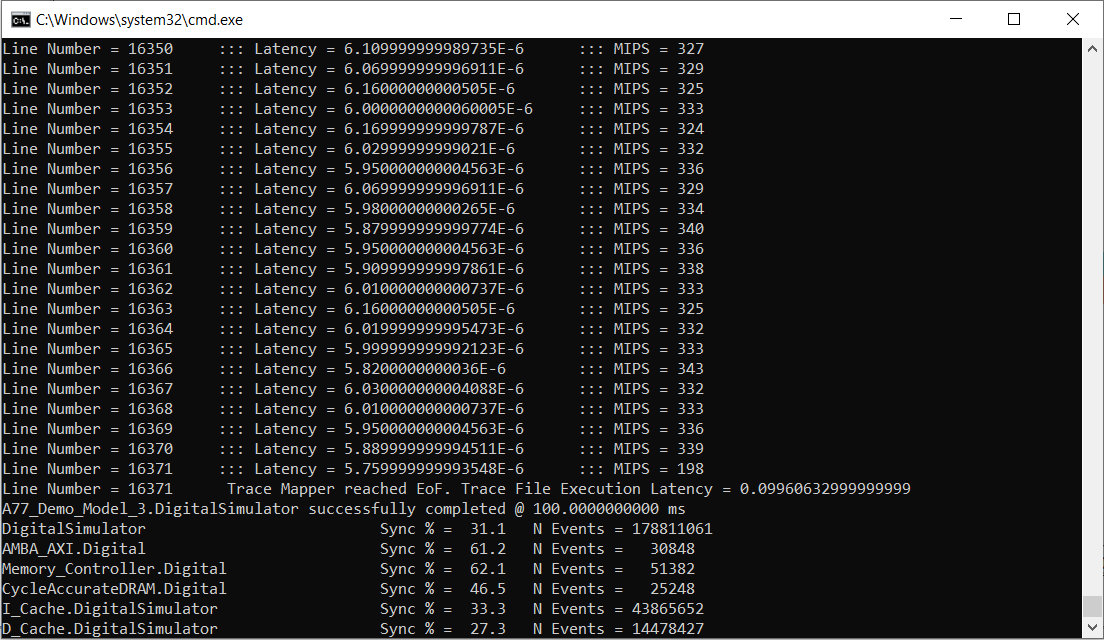
Completed Line number and the latency and MIPS for executing the
instructions in the coresponding line are also printed out in the
commandline. When the end of file is reached, the total time it took to
complete the execution of the full trace file is printed out as well.
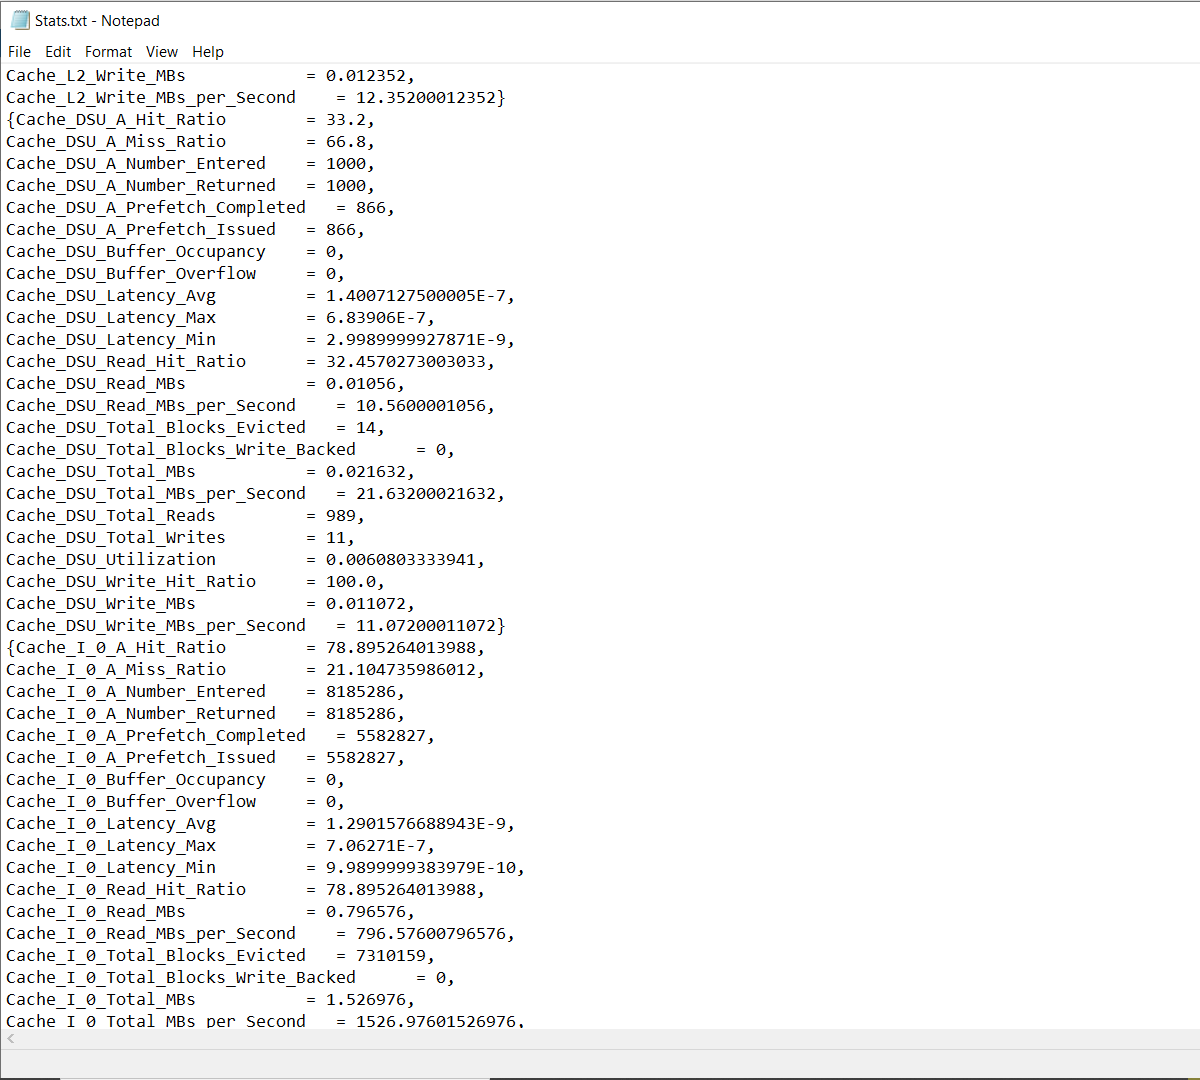
Test case 1: Modify/use a new input Trace
Steps on how to generate executed processor (arm cortex a77)
traces for the software code:
1. Install aarch64-none-linux-gnu-gcc
2. Compile the c code by setting the required flags
c code screenshot:
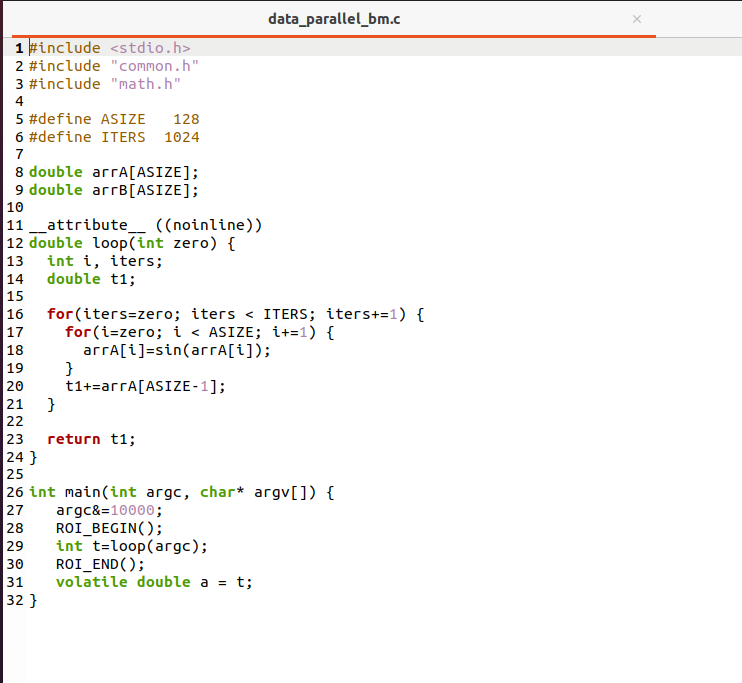
To compile the code, the following command was used:
aarch64-none-linux-gnu-gcc -mtune=cortex-a77 -mcpu=cortex-a77 -O3 -static -o data_parallel_bm data_parallel_bm.c -lm

Binary file will be generated in the same folder:

NOTE : The
following commands were used to compile the dhrystone code (which were
used by the demo model by default)
aarch64-none-linux-gnu-gcc -O0
-mtune=cortex-a77 -mcpu=cortex-a77 --static -c -DHZ=60 -O2 -fno-inline
dhry_1.c
aarch64-none-linux-gnu-gcc -O0
-mtune=cortex-a77 -mcpu=cortex-a77 --static -c -DHZ=60 -O2 -fno-inline
dhry_2.c
aarch64-none-linux-gnu-gcc -O0
-mtune=cortex-a77 -mcpu=cortex-a77 --static -o dhrystone dhry_1.o
dhry_2.o
3. Run the binary obtained in the above step on GEM5
Following line specifies the command used to run the binary on GEM5 and to get the required executed traces:
./build/ARM/gem5.opt
--debug-flags=Exec --debug-file=dptd_a77_trace
./configs/example/arm/starter_se.py --cpu minor --cpu-freq 3.0GHz
--mem-type DDR4_2400_8x8 ./tests/data_parallel_bm
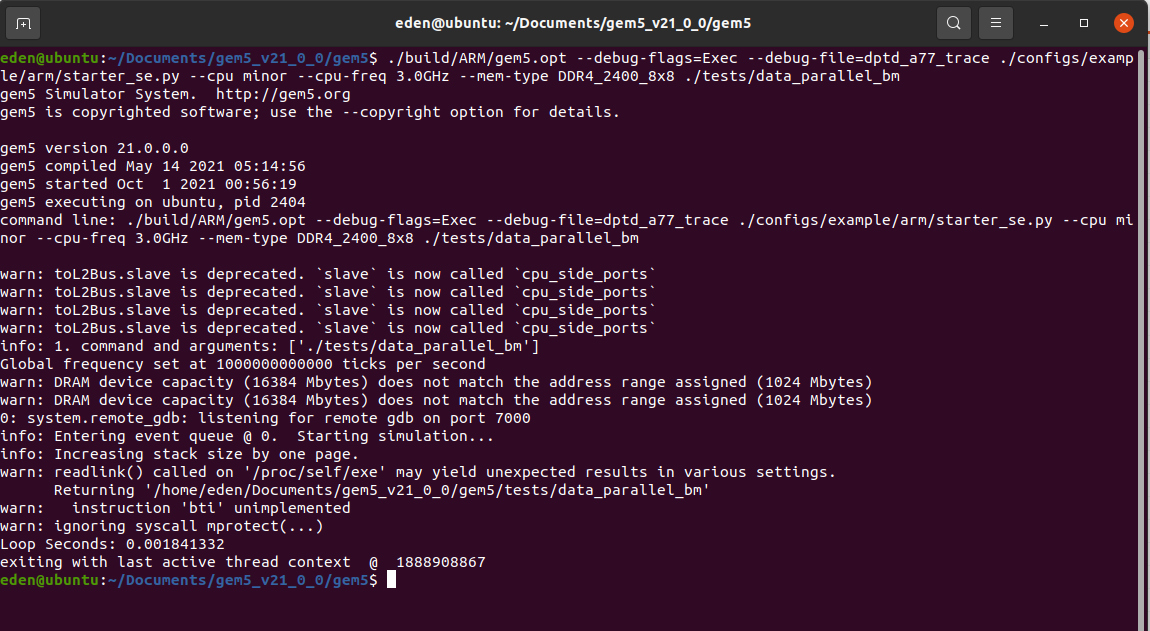
4. Once the GEM5 simulation completes, in m5out folder, we can find a file named dptd_a77_trace being generated.

The generated output file contains the following:
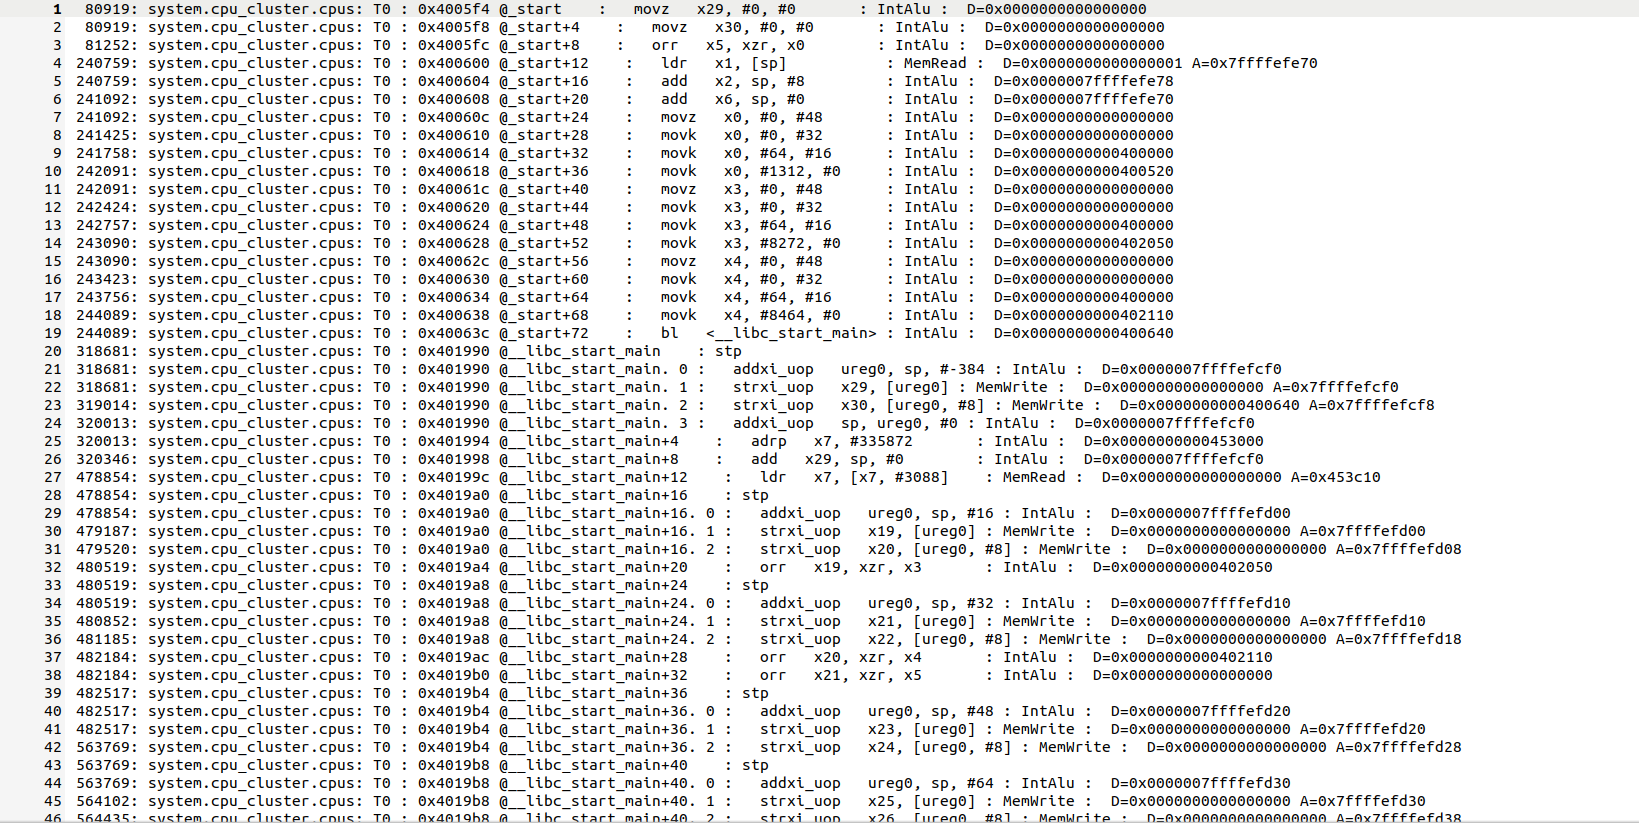
5. We use the python code (titled trace_parser_updated.py) to convert the GEM5 output file into VisualSim readable format
Following line specify the command used to generate the VisualSim readable file:
python trace_parser_updated.py
./m5_out/dptd_a77_trace ./arm_isa_a77_gem5.txt

If the python parser
prinst out "No missing instructions" , then that means everything looks
good. If any warning is generated, please contact Mirabilis Design
(info@mirabilisdesign.com)
The output file generated by the python parser can be found in the same folder where the python parser is placed:

This file contains the following:
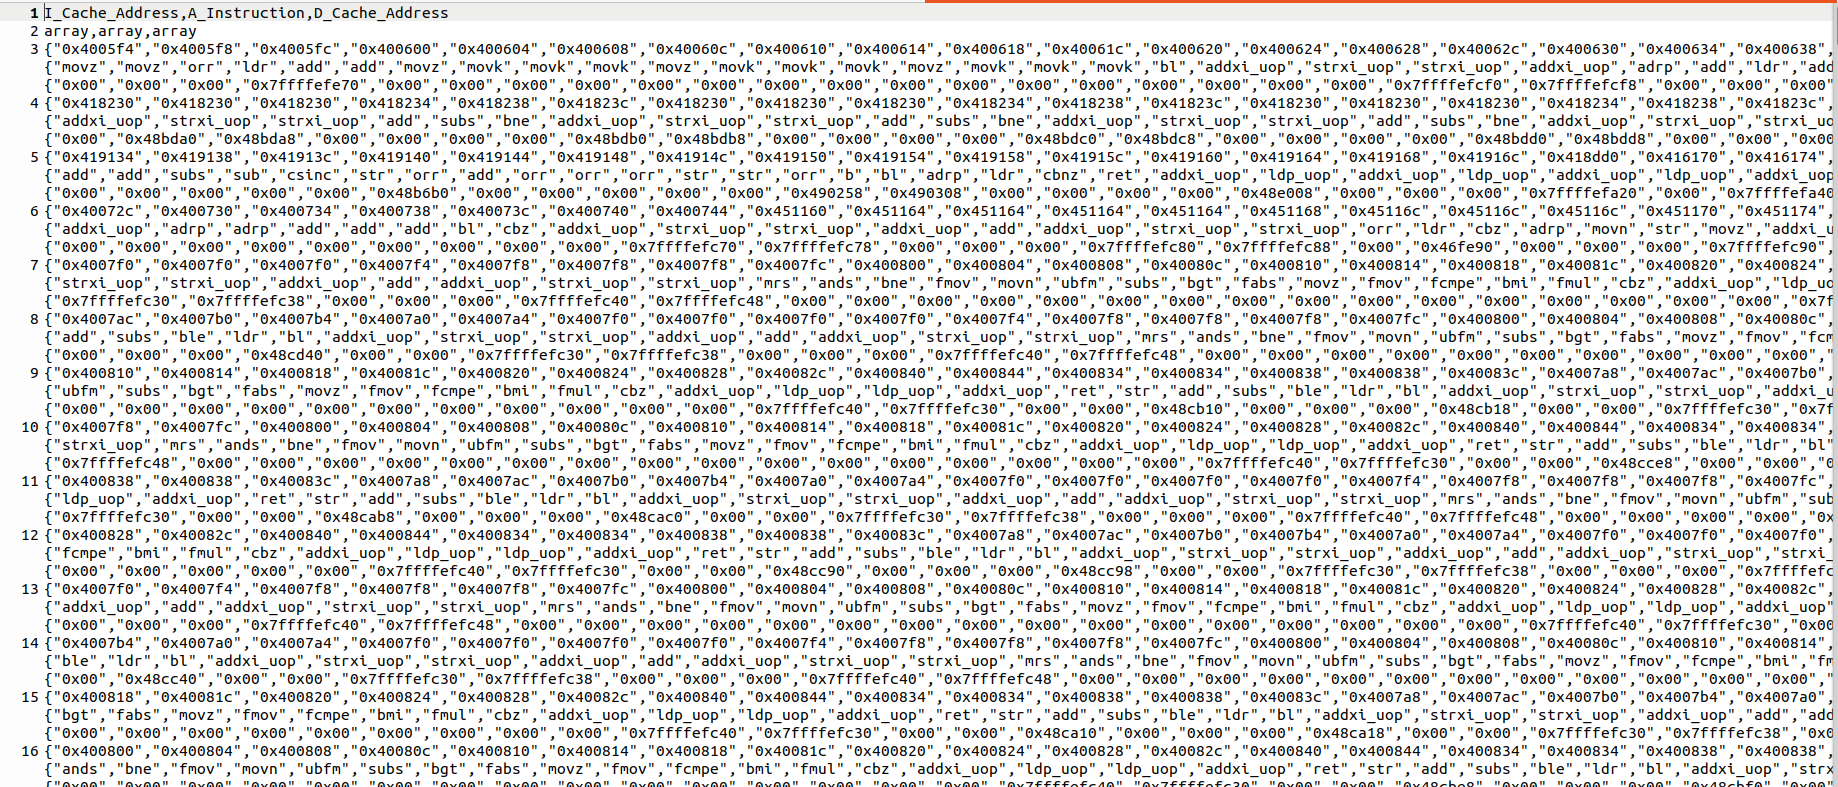
6. Update the fileOrURL parameter of Trace_Mapper
[*] Double click on Trace_Mapper
[*] Click on Browse
[*] Select the new csv file
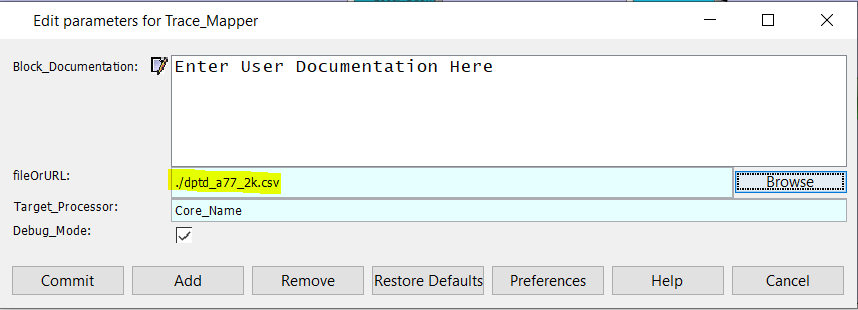
Click on Commit and run the demo model.
Results:

We can see that there is only 2239 lines in the new trace. The latency for completely executing the trace file is 1.17 msec.

The Cache Stats, Networks stats can be seen above.
Test case 2: Modify the Processor configuration
Processor Parameters:

We have reduced the max number of instructions per cycle that can be
fetched and processed. Also the Reorder buffer size is reduced. Expects
an increase in latency for this configuration.
Results:

The latency for the execution of this trace file increased to 1.54 msec. Increase in latency is observed.

Test 3 : Modify the Cache Configurations
Cache parameters:
The cache width was reduced to 128 bit instead of 256 bit:
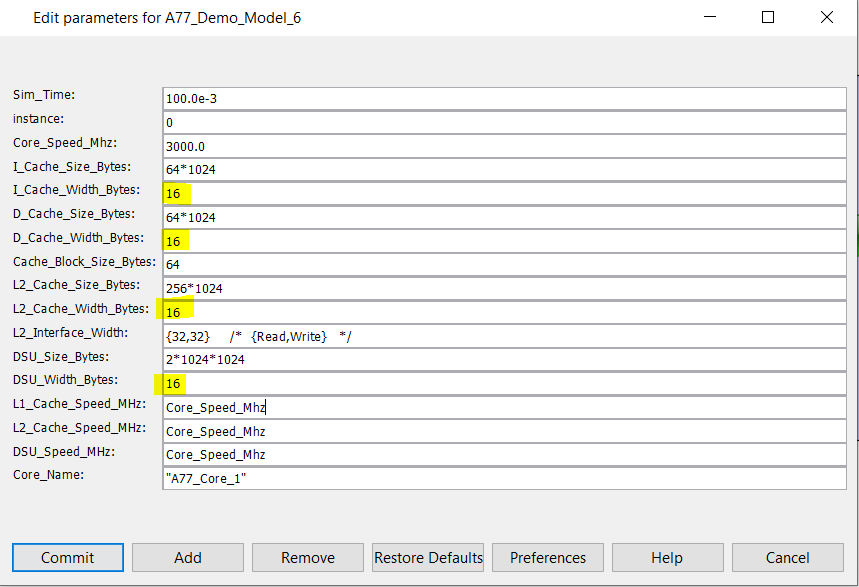


Slight change in the latency can be observed.
Test 4 : Modify the AMBA AXI Bus Configuration
Bus parameters
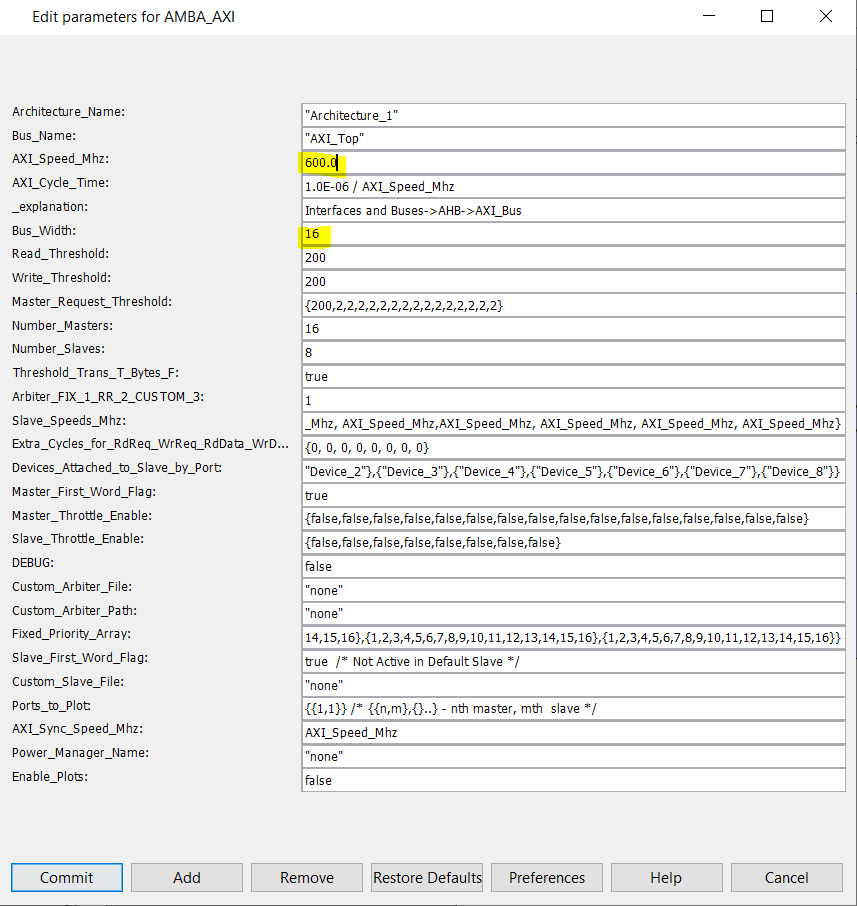


Increase in latency can be observed as Clock Speed and Width are reduced.
Test 5 : Modify the DRAM configurations
DRAM Parameters
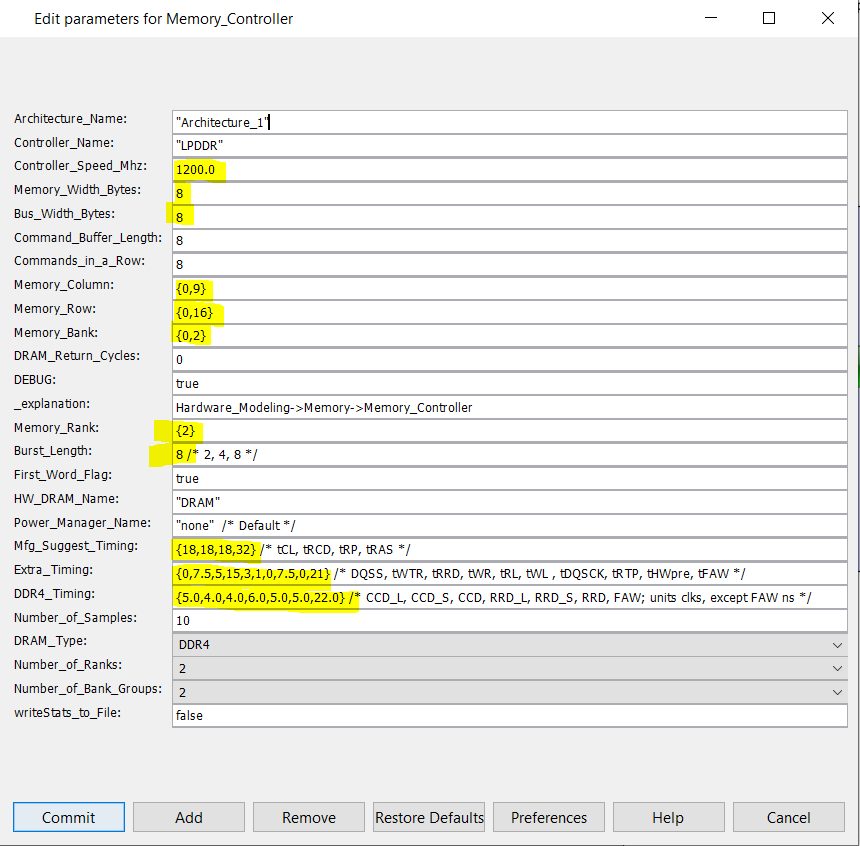
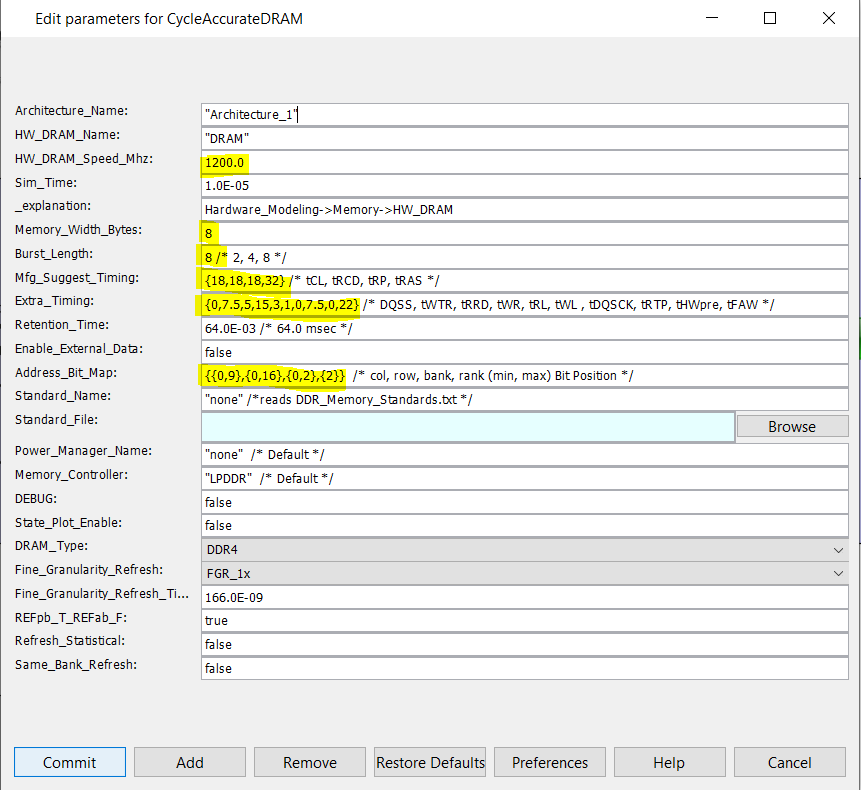
The Speed , Row, Col, Bank as well as the DDR4 timings were updated.
Results:


Increase in latency can be observed.
Test 6 : Replace AXI Bus with NoC
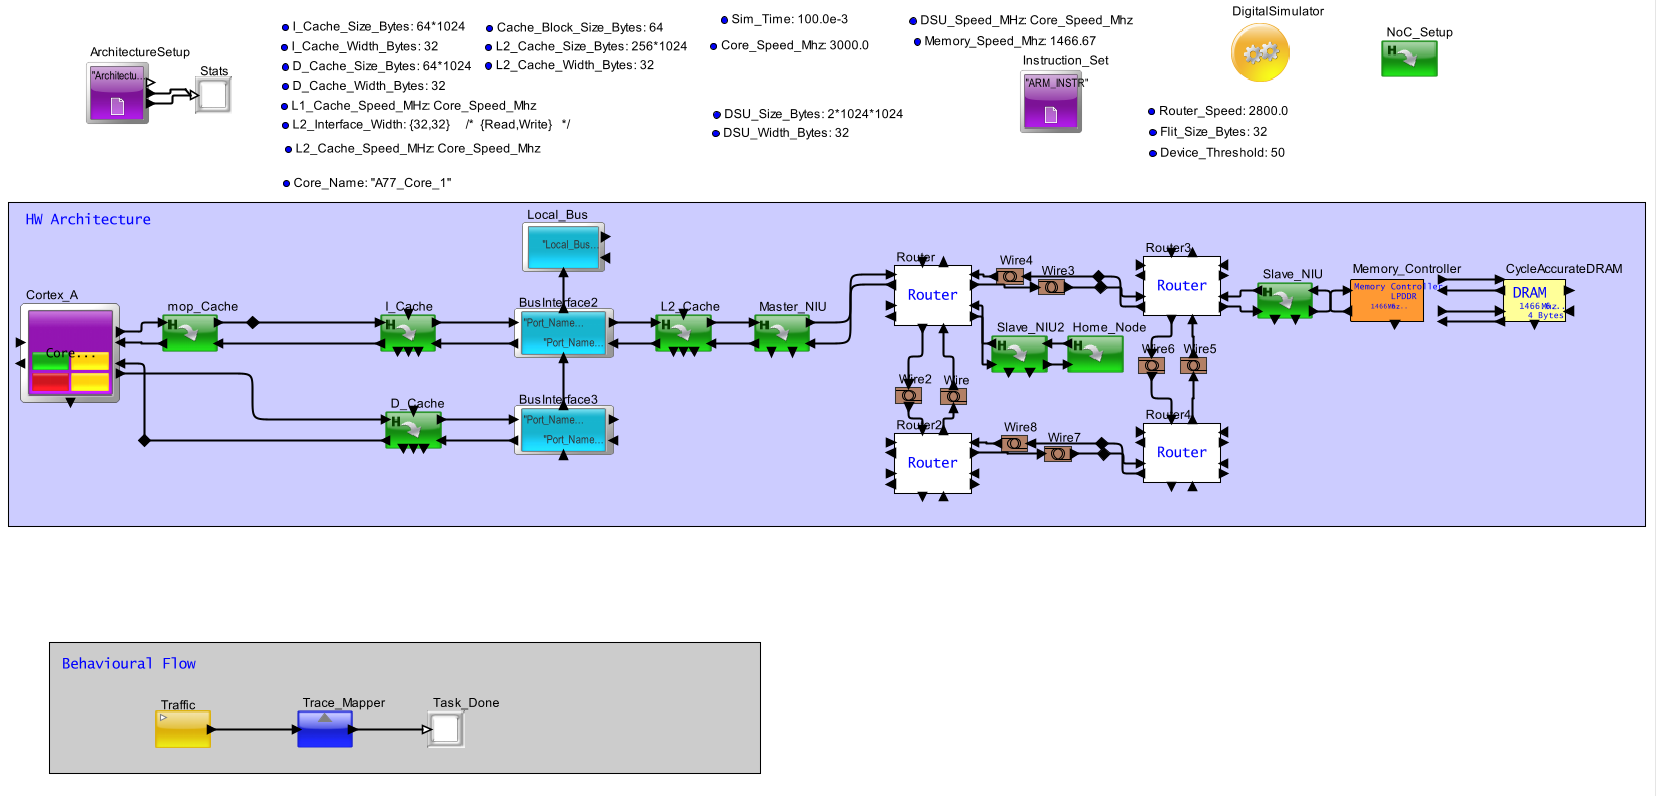
Results:


The NoC stats are printed out as well in addition to the Cache and processor stats. Increase in latency can be observed.