Use the framework available in VisualSim to design a flow control for the following objectives:
A flow control can be used to regulate data across a bus, between
the input and output on a switch, and the scheduler in the RTOS.
A typical flow control is made up of input queues, output queues, a
flow credit between the queues, and any number of intermediate queues.
There is also an arbitration/scanning algorithm that determines when
the next packet or transaction must be sent from the input queue.
The selected design is illustrated in Fig 1. The system has a large
number of input or Ingress channels that are assembled in sets and
which have their own flow control. The sets are multiplexed into a
single set of output or Egress queues.
There is always a routing to match the Egress queue with the Ingress
queues. The routing can be based on the routing path or is simply a
one-to-one matching. In this case, the queues are matched in order. The
queue one from each Ingress set is sent to the queue one of the Egress
queues. Similarly, Ingress queue two is sent to Egress queue two and so
on.
The intermediate Xon-Xoff is an additional flow control level between
the Ingress and Egress queues. Each set has its own Xon-Xoff mechanism.

In VisualSim, the block diagram is split into the
following parts:
We factor in the following variances when we model the block diagram in VisualSim. These variances are simulation-specific, either for ease of modelling or to capture statistics in the model.
Use the block information as the base and build a VisualSim model with the Library Blocks listed in the following table (Table 1).
|
S.No. |
Process |
Library Block |
| 1 |
Drag and drop a
Traffic block.
|
Dynamic Instantiation |
| 2 |
Use the SelectInstance block to select a transaction source to be put in a corresponding queue. | SelectInstance |
| 4 |
Set up a Script
for the Ingress queues to implement a round
robin algorithm to parse the transactions from individual queues. Define the scan rate for the arbitration and threshold limit for the Egress queue. The maximum input traffic rate of all the channels should be parameterised, and the actual drain rate will be Flow control back-pressured based. Note:
Data is read from the forward queue and placed in the output queue. The
data rate is equal to size of data divided by the clock speed.
|
Script |
| 5 |
Implement
intermediate channels with two queues – Xon and
Xoff - for flow of transactions.
|
Queues |
| 6 |
Build an Egress
queue and the Egress queue channels must
match the channels of each set of the Ingress queues. Add a process delay by updating the Time field. |
Server |
| 7 |
Enable a common flow for all the transactions from different Ingress queues to the Egress queues. | Mux |
| 8 |
Capture transactions from the Egress buffer and measure the latency, and display a latency histogram. (Current Time (TNow) – TIME field (Timestamp on entry)) | ExpressionList |
The following image depicts the expansion of the traffic block:

The VisualSim model is as given below:
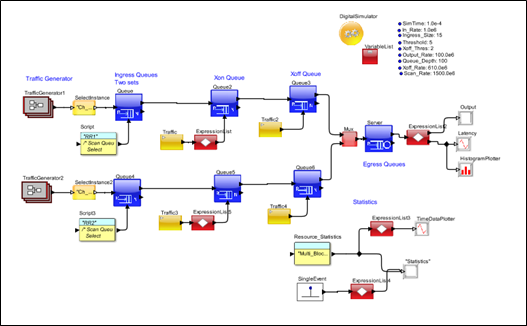
Figure 3: Flow Control
VisualSim Model
Build a Visual model using the Library blocks listed in the table to gather resource statistics and reports.
| S.No. |
Analysis |
Library
Block |
| 1 |
Gather resource statistics to evaluate the buffer occupancy, utilization, and number of transactions entered/exited. | Resoource Statistics |
| 2 |
Compute end-to-end latency between Ingress and Egress buffer. | Expression_List Example: TNow – input.TIME |
| 3 |
Compute buffer occupancy details for Ingress buffer. | Expression_List Ex: Result_A = input(0) Result_A.Occupancy_Mean |
After you gather resource
statistics, conduct a system analysis by varying model parameters,
block configurations, and modifications to workload and use cases.
Generate reports to answer design queries for making architectural
decisions. Typical reports include end-to-end latency, throughput,
utilization of buses, processors, accelerators, network bandwidth,
buffer occupancy and power consumption. This tutorial confines to
generating end-to-end latency and buffer occupancy reports.
Conduct the analysis
for the following objectives:
System Configurations
For Analysis 1, consider the following system configurations:
Compute the end-to-end latency
using TNow – input.TIME RegEx expression. Here TNow returns current
time stamp details and input.TIME returns time at which transaction is
generated.
End-to-End latency for Analysis 1 is given below.
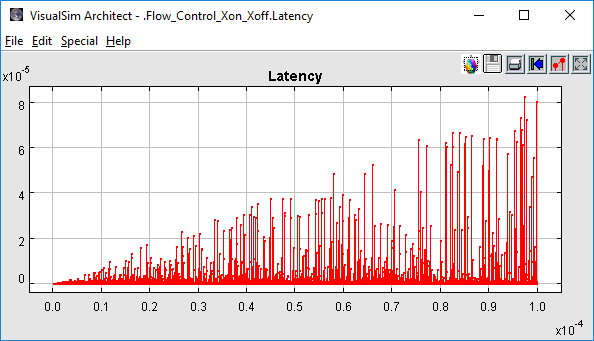
Figure 4: Flow Control Latency Report
Latency
graph shows that the end-to-end latency for the complete system. X-axis
is the simulation time and Y-axis displays latency in seconds. Latency
increases gradually and also shows that the standard deviation between
maximum and minimum is huge and may result in unpredictable system
behaviour.
You may make the following
modifications to the system:
Buffer Statistics
Gather buffer statistics for the Ingress buffer as its throughput relies on availability of the Egress buffer. Statistics suggest that the Ingress buffer is occupied with a maximum of 29 packets out of 100 packets. This is the major reason for increased end-to-end latency.
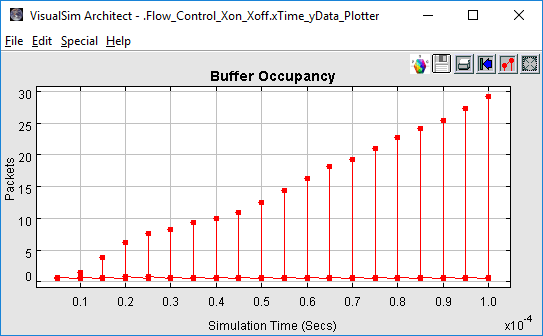
Figure 5: Flow Control
Buffer Statistics
Throughput Statistics
The Input and Output Throughput statistics provides details on the channels that are dropping the packets due to channel congestion or non-availability of sufficient bandwidth. Given below is a custom Input/Output Throughput stats in MBps.
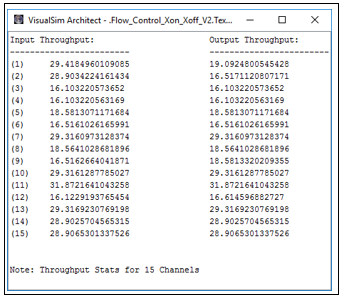
Figure 6: Flow Control Throughput Statistics
The reports show that except
Channel number 2, output throughput of all the channels are same or
close to input throughput. This suggests that either the designer must
provide more bandwidth or reduce the input traffic rate.
In this analysis, increase the Scan clock by 100Mhz and Output rate by 1500Mhz. The resultant Input vs Output throughput statistics is given below.
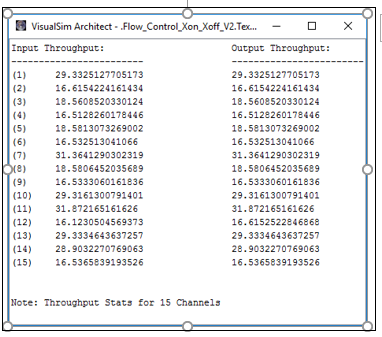
Figure 7: Flow Control
Throughput Statistics 2
Inference
from Analysis 1
From the reports for Analysis 1,
you infer that you can improve system performance either by reducing
the channel input rate or increase the “Scan_Rate” and clocking Egress
buffer at higher clock speed.
Analysis 2
System Configurations
For analysis 2, consider the
following system configurations:
Compute the end-to-end latency using TNow – input.TIME RegEx expression. TNow returns the current time stamp details and input.TIME returns time at which transaction is generated.
End-to-End latency for Analysis 2 is given below:
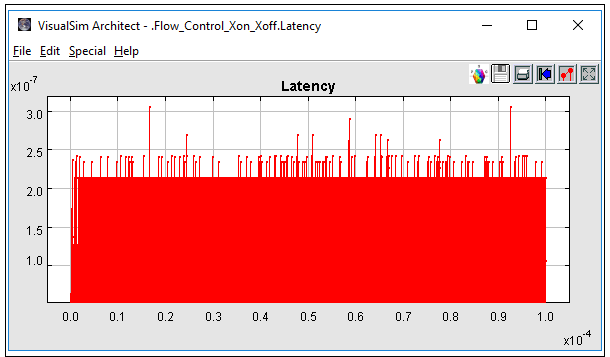
Notice that the end-to-end
latency for Analysis 2 is quite stable and also suggests that system
performs effectively over time and does not show any buffering related
problems.
The following figure helps understand buffer occupancy details for the
Ingress buffer.
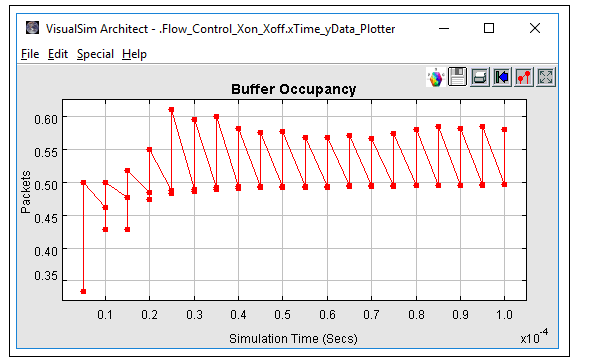
Figure 9: Flow Control
Buffer Occupancy
Inference from
Analysis 2
Mean Ingress buffer occupancy
does not exceed more than one packet and hence Ingress buffer does not
have any impact on the performance.
Analysis 3