Switch Design
Tutorial Goals
The following is a summary of the concepts you will learn in this session.
- Define a flow diagram.
- Setup the Routing between Systemic components.
- Mapping from behavior to hardware platform.
Target
The purpose of this session is
to build a performance model that calculates the statistics and identifies
system bottlenecks and evaluates the performance of different
applications on the target architecture. The block diagram of this
system is shown in Figure 1. The system has two identical cores on a
shared bus with a cache and SDRAM.

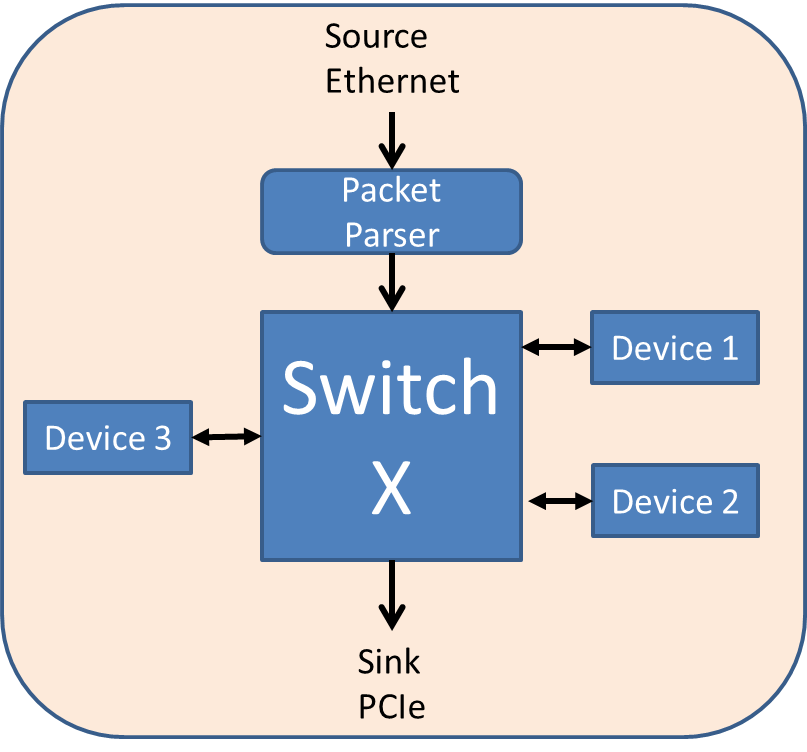
Figure 1: Block Diagram of the Switching System
VisualSim Tutorial Model Location
Open this model in VisualSim from the following location:
File->Open File->$VS/doc/Training_Material/Tutorial/WebHelp/Tutorial/Performance_Modeling/Switch_Tutorial.xml
Model Objectives
- Define the sequence of events.
- Dynamically map each transaction to one of the processing units.
- Create the routing table and a Central switch that connects all the devices together.
- Vary the workload speed and evaluate the processing unit throughput and switch buffering.
The analysis determines
the system-level impacts of varying the parameters and the system
workloads. The generated reports must capture the latency over
time, the utilization and buffering at each device and the effective
throughput.
Blocks Used
Sl No
|
Library Block
|
Description
|
1
|
Digital Simulator

ModelSetup > Digital
|
This
Simulator is used to model protocols, hardware, and mapping of behavior
to architecture. This simulator is used when the model is being
triggered as an event or based on time. The Digital Simulator
implements the discrete-event Model of Computation (MoC). This
Simulator maintains a notion of current time, and processes events
chronologically in this time.
|
2
|
Transaction Sequence

Full Library > Source > Traffic > Transaction_Sequence
|
This
block is used to generate a sequence of data structures. Each line of
the file or Window is a data structure. The sequence can be modulated
by using the trigger port, Time and/or the Probability fields.
|
3
|
Processing

Full Library > Defining Flow > Processing
|
The Processing blocks executes a sequence of expressions in order.
The expressions can use the
data on all the Input ports, RegEx, Memories (Global and Local),
Parameters, Numerical values, and String Constants.
|
4
|
Mapper

Mappers > Mapper
|
This
block works with the separation of the behavior and architecture
methodology. In this methodology, the mapper block is placed in
behavior flow at every location where a timed resources is
required.
|
5
|
IN

FileIO > Database
|
This
block accepts incoming Data Structures or tokens from any
OUT/MUX/uEngine/Virtual_Machine blocks and sends a value on the output
port. The single parameter called Destination_Name is composed of two
parts- the name and the value to be output, separated by ".".
|
6
|
OUT

Behavior > Expression List
|
The
Decision blocks executes a sequence of expressions in order and sends
the Output_Value on each of the Output_Ports based on the
Output_Condition for that Port.
The expressions can use the
data on all the Input ports, RegEx, Memories (Global and Local),
Parameters, Numerical values, and String Constants.
|
7
|
Text Display

Results > Text > Text_Display
|
Display
the values arriving on the input port in a text display dialog. This
block buffers the display data and updates the screen after the buffer
is full.
|
8
|
TimeDataPlotter

Results > TimeDataPlotter
|
This
block plots the incoming data on the Y-Axis against the current
simulation time on the X-axis. Every wire connected to this block input
is considered a separate dataset and plotted separately.
|
9
|
Server

Resources > Server
|
This
block is a timed resource that combines multiple concurrent input queue
and an associated processing (server) resource. A timed resource
consumes units of time to emulate the processing delay across a entity.
|
10
|
SystemResource

Resources > SystemResources
|
This
block forms the architecture part of the behavior and architecture
separation methodology. In this methodology, the data structures
are transfered along the behavior flow.
|
11
|
ResourceStatistics

Results > ResourceStatistics
|
This
is a pre-built block to place in a model to output or reset the
statistics for all the Schedulers, Channel, Channel_N,
Smart_Timed_Resource, and Smart_Resources in the model.
|
System Description
The following information describes the system:
- Block Diagram in Figure 1.
- Supports n number of Processing Devices.
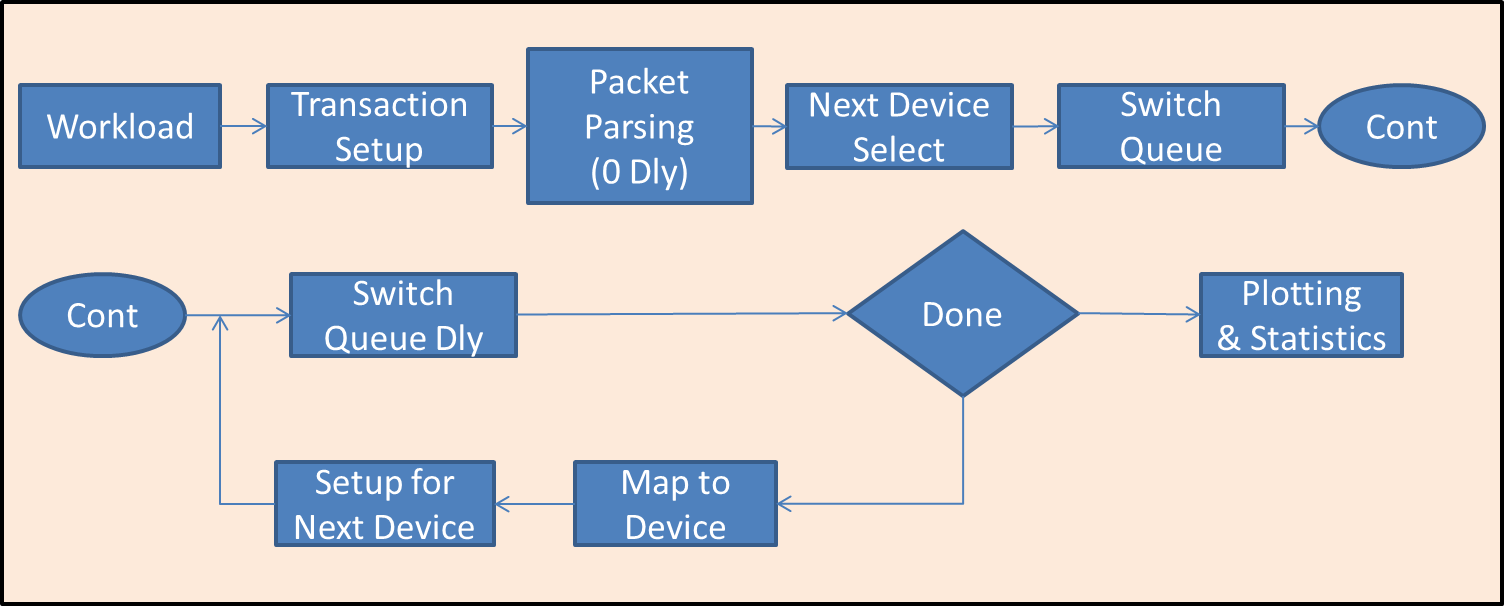
- The flow diagram is shown in Figure 2.

Figure 2: Flow of Packets from Source to Sink after processing in multiple devices
- Workload Mean rate= 1.0 seconds
- List of Fields required for storing simulation information
- List of Types and their associated processing sequence
- Queue connection for each Device
- Processing delays at the Devices and Switch
Translation to Model Speak
The key concept in modeling is
to model all the elements that are relevant to the analysis and
abstract out the rest. The first are the list of processing devices
that are modeled using SystemResource. The switch is modeled as a Server. The rest are a series of logic to define the
movement of the data and capture statistics. The model consists
of 5 parts - workload, data structure setup, lookup, queue + processing
servers with scheduling algorithm, and statistics gathering.
Model Block Diagram
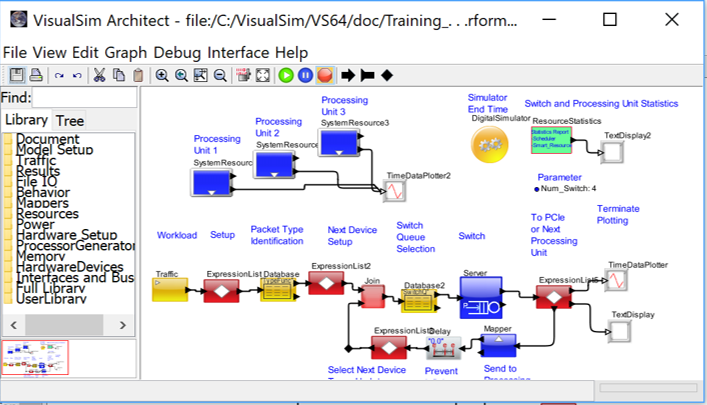
The information from the system descriptions and assumptions are compiled into this model diagram.

Figure 3: Execute the model
Building the Model
The following are the translation between the flow diagram and the model elements:
- ModelSetup > Digital
- Parameters - Create parameters as follows:
- Num_Switch
=
4 The number of queues in the switch. It shows the number of
connected devices
- For Traffic use "Traffic" block. The tutorial shows traffic being generated at the rate of one packet/ second.
- For setup, use the ExpressionList
block. The ExpressionList block has multiple purposes. This
includes computing statistics, updating information in memories, and
modifying/updating/creating field values.
- What is the purpose of the
Task_Number field of the Mapper? Try out the Priority for both the
Server and the
SystemResources. Notice how the performance changes. This is
because the queues are reordered every time a new packet arrives.
- Use the Mapper block in the flows to connect the behavior with the architecture.
- Use the ExpressionList block to route the packet through the model flow.
- Statistics
- Timing diagrams show the
individual device activity. How was this created? Also, notice that the
Task_Number has a huge impact. Also, take a look at the Trace field of
the data structure.
- Use the
Results > ResourceStatistics to capture the statistics of the
devices. We will capture architecture element statistics at the end of
the simulation.
- Execute the simulation and correct any errors.
Analysis
- Modify the Mean_Time of the Workload.
- Change the processing time on the Devices.
- Modify the sequence of the Devices to be executed for each Type. Add more Devices in the flow.
- Add more devices, tasks, and number of items in the sequence.
- Add packet size and make the switch delay a function of the packet size and the switch clock delay.


