Use
the framework available in VisualSim to design an embedded application
made of multiple concurrent tasks that execute on an embedded system
board. Objectives of the tutorial are as follows:
Software application behavior is a unique watermark
and requires a hardware configuration that meets the requirements. It
is imperative that the application is evaluated on a range of target
platforms to determine the most-suitable platform. This ensures that
the production software does not have to be modified when the system is
integrated.
In this tutorial, you define the behavior of an embedded software
application as a sequence of activities that run on a target platform.
Design Methodology
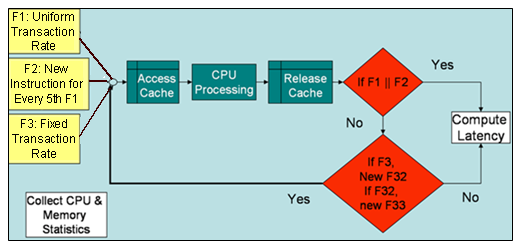
The block diagram of this system is shown in Fig 1.

Figure 1: Embedded Board Design Block Diagram
A correctly assembled model must look as below. You can also compare your model with the following model:
Figure 2: VisualSim Model
The system comprises the following hardware components:
| Task F1 |
Task F2 |
Task F3 |
|
|
Task F31: Execution length: 10 ms Memory amount: 200 bytes Task F32: Execution length: 5 ms Memory amount: 100 bytes Task F33 : Execution length: 20 ms Memory amount: 300 bytes |
The key concept in modelling is to provide sufficient accuracy for
all the relevant components and abstract the rest to delays. The
hardware elements (Cache and CPUs) and the task set are relevant. Items
such as the RTOS are not included in this study as they are common
overhead for all the operations.
To translate the above requirements into model speak, consider the
model to have five basic structures - architecture, behavior, workload,
model parameters, and analysis. All of the requirements above must fit
into one of these structures.

Figure 3: Parameters
Build Architecture
| S.No. |
Parameters |
Value |
Details |
| 1. |
Resource_Name |
“Processor” |
This is the name of this SystemResource block and is used by the Mapper to call this block to execute a transaction. |
| 2. |
Task_Context_Switch_Time |
3.0 |
Task_Context_Switch_Time is used
to model the time to switch between one scheduler task and another
task. If the value is greater than 0.0, it is added to all new tasks
starting, and before and after a task is pre-empted. |
| 3. |
Clock_Rate_Mhz |
1.0 |
The Clock_Rate_Mhz is used to model delays, only if the Time_Type is 'Number_Clocks'. Scheduler delay is 'Task_Time' / (Clock_Rate_Mhz * 1000000.0). This value is ignored if the Time_Type is set to "Relative_Time. |
| 4. |
Time_Type |
Number Clocks |
Use 'Number_Clocks' to model
more detailed behavior, such as a bus. In this case, the Task_Time in
the Mapper blocks is the number of cycles. The Clock_Rate_Mhz of the
System_Resource is used. The Delay Time = Task_Time / (Clock_Rate_Mhz *
1000000.0). If the Data Structure arrives out of sync with the clock, the processing does not start until the next clock cycle. |
| 5. |
Scheduler_Type |
FCFS + Preempt |
'FCFS + Preempt' is a
First-Come-First-Serve scheduler that supports priority and preempts an
executing task, if a higher priority task arrives. |
| S.No. |
Parameters |
Value |
Details |
| 1. |
Start_Time |
0.0 (For Traffic) 0.1 (For Traffic1) |
This Parameter is the time delay
before the first data structure is generated. The Default Value : 0.0
which is equal to one (1) TimeResolution value. |
| 2. |
Value_1 |
0.002 (For Traffic) 0.08 (For Traffic1) |
Value1 is a parameter for the
Time_Distribution. This is in units of time where 1.0 = 1 Second. Based
on the selected distribution, this value is used differently. |
| 3. |
Value_2 |
2.0 (For Traffic) 0.12 (For Traffic1) |
Value2 is a parameter for the
Time_Distribution. This is in units of time where 1.0 = 1 second. Based
on the selected distribution, this value is used differently. |
| 4. |
Time_Distribution |
Fixed (Value_1) (For Traffic) Uniform (Value_1, Value_2) (For Traffic1) |
Fixed (value1) selection means a packet will be generated for every Value_1 seconds Uniform (value1,value2) selection means the packet will generated for a uniform time between value1 and value2 |
| S.No. |
Parameter |
Value |
| 1. |
Expression_List |
input.Execution_Length = 0.00001 / Clock input.Memory_Amount = 20 input.Priority = 2 input.Task_Number = 1 |
| 2. |
Output_Ports |
Output |
| 3. |
Output_Values |
Input |
| 4. |
Output_Conditions |
true |
| S.No. |
Parameter |
Value |
| 1. |
Expression_List |
F2_Count = F2_Count + 1 Result_A = (F2_Count == 5)?True:False F2_Count = (Result_A == True)?0:F2_Count /* F2 Task Definitions */ input.Execution_Length = 0.004 / Clock input.Memory_Amount = 100 input.Priority = 1 input.Task_Number = 2 |
| 2. |
Output_Ports |
output |
| 3. |
Output_Values |
input |
| 4. |
Output_Conditions |
Result_A |
| S.No. |
Parameter |
Value |
| 1. |
Expression_List |
input.Execution_Length = 0.010 / Clock input.Memory_Amount = 500 input.Priority = 0 input.Task_Number = 3 |
| S.No. |
Parameter |
Value |
| 1. |
Resource_Capacity |
Mem_Capacity |
| 2. |
Max_Queue_Occupancy |
30 |
| S.No. |
Parameter |
Value |
| 1. |
Expression_List | /* none required */ |
| 2. |
Output_Ports |
output |
| 3. |
Output_Values |
true |
| 4. |
Output_Conditions |
true |
| S.No. |
Parameter |
Value |
| 1. |
Expression_List |
/* none required */ |
| 2. |
Output_Ports |
output, MemReq, Priority, memBank |
| 3. |
Output_Values |
input, input.Memory_Amount, input.Priority, 1 |
| 4. |
Output_Conditions |
true, true, true, true |
| S.No. |
Parameters |
Value |
| 1. |
Target_Resource |
"Processor" |
| 2. |
Task_Number |
"Task_Number" |
| 3. |
Task_Priority |
"Priority" |
| 4. |
Task_Time |
"Execution_Length" |
| 5. |
Task_Plot_ID |
1 |
| S.No. |
Parameters |
Value |
| 1. |
Block_Name |
"Next_Task" |
| /*
Start of
Statistics
*/ if (input.Task_Number == 1 || input.Task_Number == 2 || input.Task_Number == 5) /* Indicates end of task */ { if (input.Task_Number == 1) { Latency = TNow - input.TIME SEND (Plot, Latency) } else if (input.Task_Number == 2) { Latency = TNow - input.TIME SEND (Plot1, Latency) } else if (input.Task_Number == 5) { Latency = TNow - input.TIME SEND (Plot2, Latency) } } else if (input.Task_Number == 3) /* Spawns new task 4 */ { input.Execution_Length = 0.005 / Clock input.Memory_Amount = 100 input.Priority = 0 input.Task_Number = 4 SEND (Next_Task, input) } else if (input.Task_Number == 4) /* Spawns new task 5 */ { input.Execution_Length = 0.020 / Clock input.Memory_Amount = 300 input.Priority = 0 input.Task_Number = 5 SEND (Next_Task, input) } /* End of Script */ |
A correctly assembled model must look as given below. You can also compare your model with the following model:
If there is no data flowing
through the model, then a problem arose due to incorrect parameter
settings or mismatches in the port data Type. Due to this problem, a
user-defined exception is displayed. The exception also indicates a
possible solution.
For Example, if the DS name has been set incorrectly then the user might get the following Exception.
| Exception Details |
|
| Block_Name |
Embed_Proc_Lab.Traffic |
| Error |
Creation of a Data Structure (DS) failed |
| Error_Number |
Transaction_Source_02 |
| Possible_Solution |
Creation of a Data Structure (DS) failed
|
| Description |
Data Structure Path.Name or Name: CPU_DS |

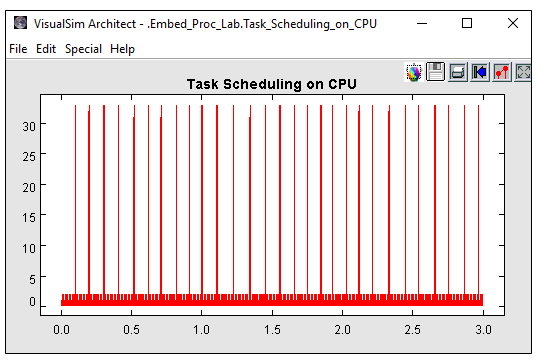
In Figure 4, X-axis shows the CPU time spent on each task processing,
Y-axis shows the task number. Zoom into a small region to see the
activity time.
Figure 12: Analysis Latency
X-Axis is the simulation time and Y-Axis is the end-to-end latency for the Function 3.

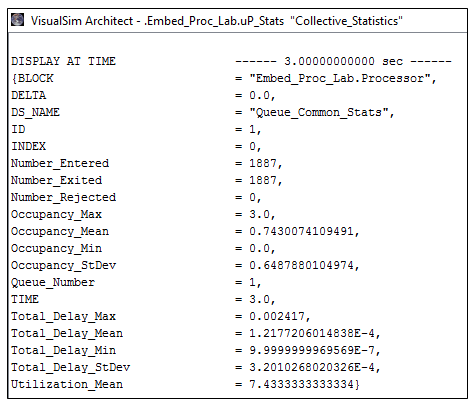
Figure 13: Analysis - Collective Statistics
Figure 6 suggests that
there are about 1887 tasks entered and exited in the Processor. There
is a maximum occupancy of 3 tasks waiting for processing and
approximately 1 task will be in queue waiting for processing.
Utilization of 7.4% suggests that CPU is underutilized and can be
replaced with a low performance processor for the current requirements.

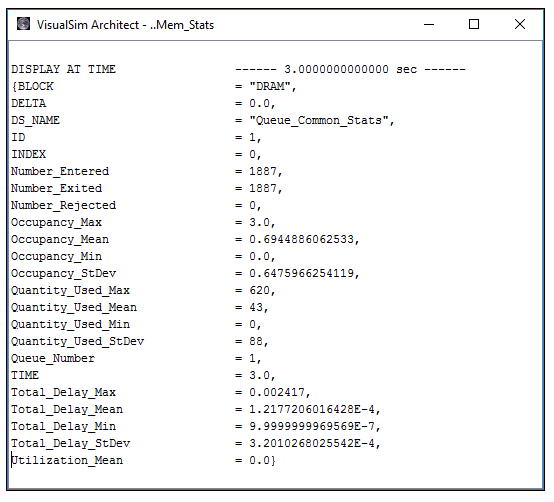
Figure 14: Analysis - Memory Status