Data centers are backbone of cloud data processing. A data center is both the building that houses computer systems and the electronics within. It is a network of computing, communication and storage resources that enables delivery of applications and data. The security and reliability of data centers are the top priorities. To ensure the best performance, the data center architecture strive for – network bandwidth, server performance and storage response.
Applications include:
• Data management
• Productivity software
• E-commerce
• Gaming
• Artificial intelligence
• Virtual desktops, and collaboration
Challenges?
Have you heard of the album “Born This Way” by Lady Gaga. The vast server resource of Amazon.com crashed after her album was offered online for 99 cents. Similarly, after announcement for a big sales event in Target.com, due to huge rush of online shoppers caused the data center to crash. There was the famous healthcare.gov debacle, when an ad campaign prompted millions of Americans to rush to the website for healthcare coverage only to face long virtual lines and endless error messages. In total, it is estimated that more than 40,000 people at any one time were forced to sit in virtual waiting rooms as available capacity had been exceeded.
Data center manager have to ensure that their data center strategy stays ahead of organization expansion needs. Besides, it should watch out for sudden peak requirements that have the potential to overwhelm current systems. Planning data center projects is a major challenge. Plans are often poorly communicated among stakeholders, and minor changes can result in major cost consequences further down the road. Planning mistakes often propagate through later deployment phases, resulting in delays, cost overruns, wasted time and, potentially, a compromised system. Analytic tools geared around data center strategy can also be used. These tools are designed to help companies balance business requirements with objective analysis, enabling them to make sound decisions based on their availability, capacity and total cost of ownership (TCO) requirements.
Forecasting, automating and increasing the accuracy are some of the important points of consideration. Gaining insight into capacity utilization over time, data center operators can effectively plan and maximize utilization. Forecasting capabilities reduce over-provisioning and allow data center operators to anticipate the impact of future installations on critical infrastructure.
The power consumption ranges from 200 billion kWh/a in 2010 to almost 3,000 billion kWh/a by 2030. For the year 2030, “only” an increase in the energy demand of datacenters worldwide to 1,929 billion kWh/a is predicted. Forecasts beyond 2020 are even more difficult due to the unclear development of technologies and the extent to which data centers and the services they provide will be used in the future. However, energy-efficient operation of data centers will continue to be of great importance in the future.
The U.S. Department of Energy’s Lawrence Berkeley National Lab (Berkeley Lab) reports that data centers in the United States use 70 billion kW hours (kWh) of electricity per year, which is 1.8 percent of total U.S. electricity consumption. At an average cost of 10 cents per kWh, that comes to a total of $7 billion a year in energy costs. Worldwide, it is estimated that data centers consume about 3 percent of the global electric supply and account for about 2 percent of total Green House Gas emissions. That’s about the same as the entire airline industry. Producing electricity consumed by data centers will result in the release of 100 million metric tons of carbon dioxide (CO2).
Addressing the problem of high energy use is a significant issue due to financial and environmental effects. So, it is important to improve the resource allocation algorithms and proposing new management approaches which aims to enhance the power efficiency in the data centers. The proposed data center must be both visualized and explored prior to the deployment. This requires a graphical simulation environment and the ability to integrate data and models from multiple sources. For example the simulation must be able to import network traces and export the configuration into MS-Excel or other database systems. The power of simulation can be expanded to integrate with performance monitoring and forecasting software. The best solution would be a really customized integration.
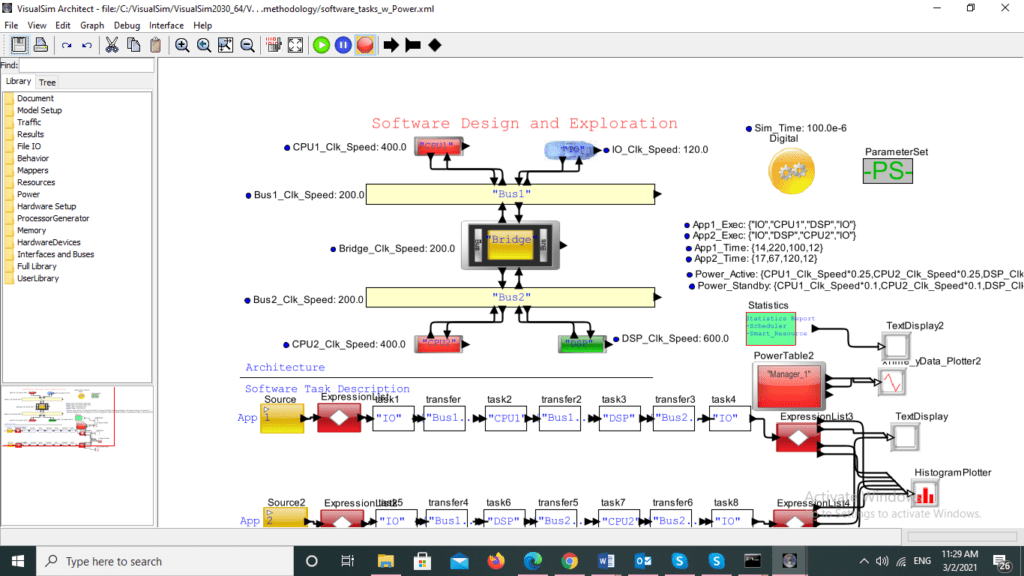
 Figure 1: Software Design and Exploration
Figure 1 gives us the model view of Software Design and Exploration. The model is simulated for 100 microseconds. The source generates the traffic and the expression list block executes the sequence of expressions in order. The block immediately starts executing as soon as the input port receives the data. The input can be of any data type including a data structure. The IO takes in the input and transfers it to the Bus 1, which is further taken up by processor (CPU 1). The data so processed is transferred to the bus. The Digital Signal Processors (DSP) take real-world signals and transfers it to bus 2. The IO block contains processors that processes the data. The expression list evaluates the output condition and then plots it in the text plotter or the Histogram plotter as per the evaluated conditions. The text plotter displays the values arriving on the input port in a text display dialog whereas the histogram plotter accepts data on the input and plots them as a histogram.
Digital twin solutions by connecting real-time data feeds from the physical system to a virtual GUI environment to detect the efficiency possible and also the bottlenecks in a design can help to save millions of dollars and also time.